Model checking and model validation

David L Miller

Biomathematics and Statistics Scotland

UK Centre for Ecology and Hydrology

We’ve fitted a model,
but is it good?

How good is the fit?

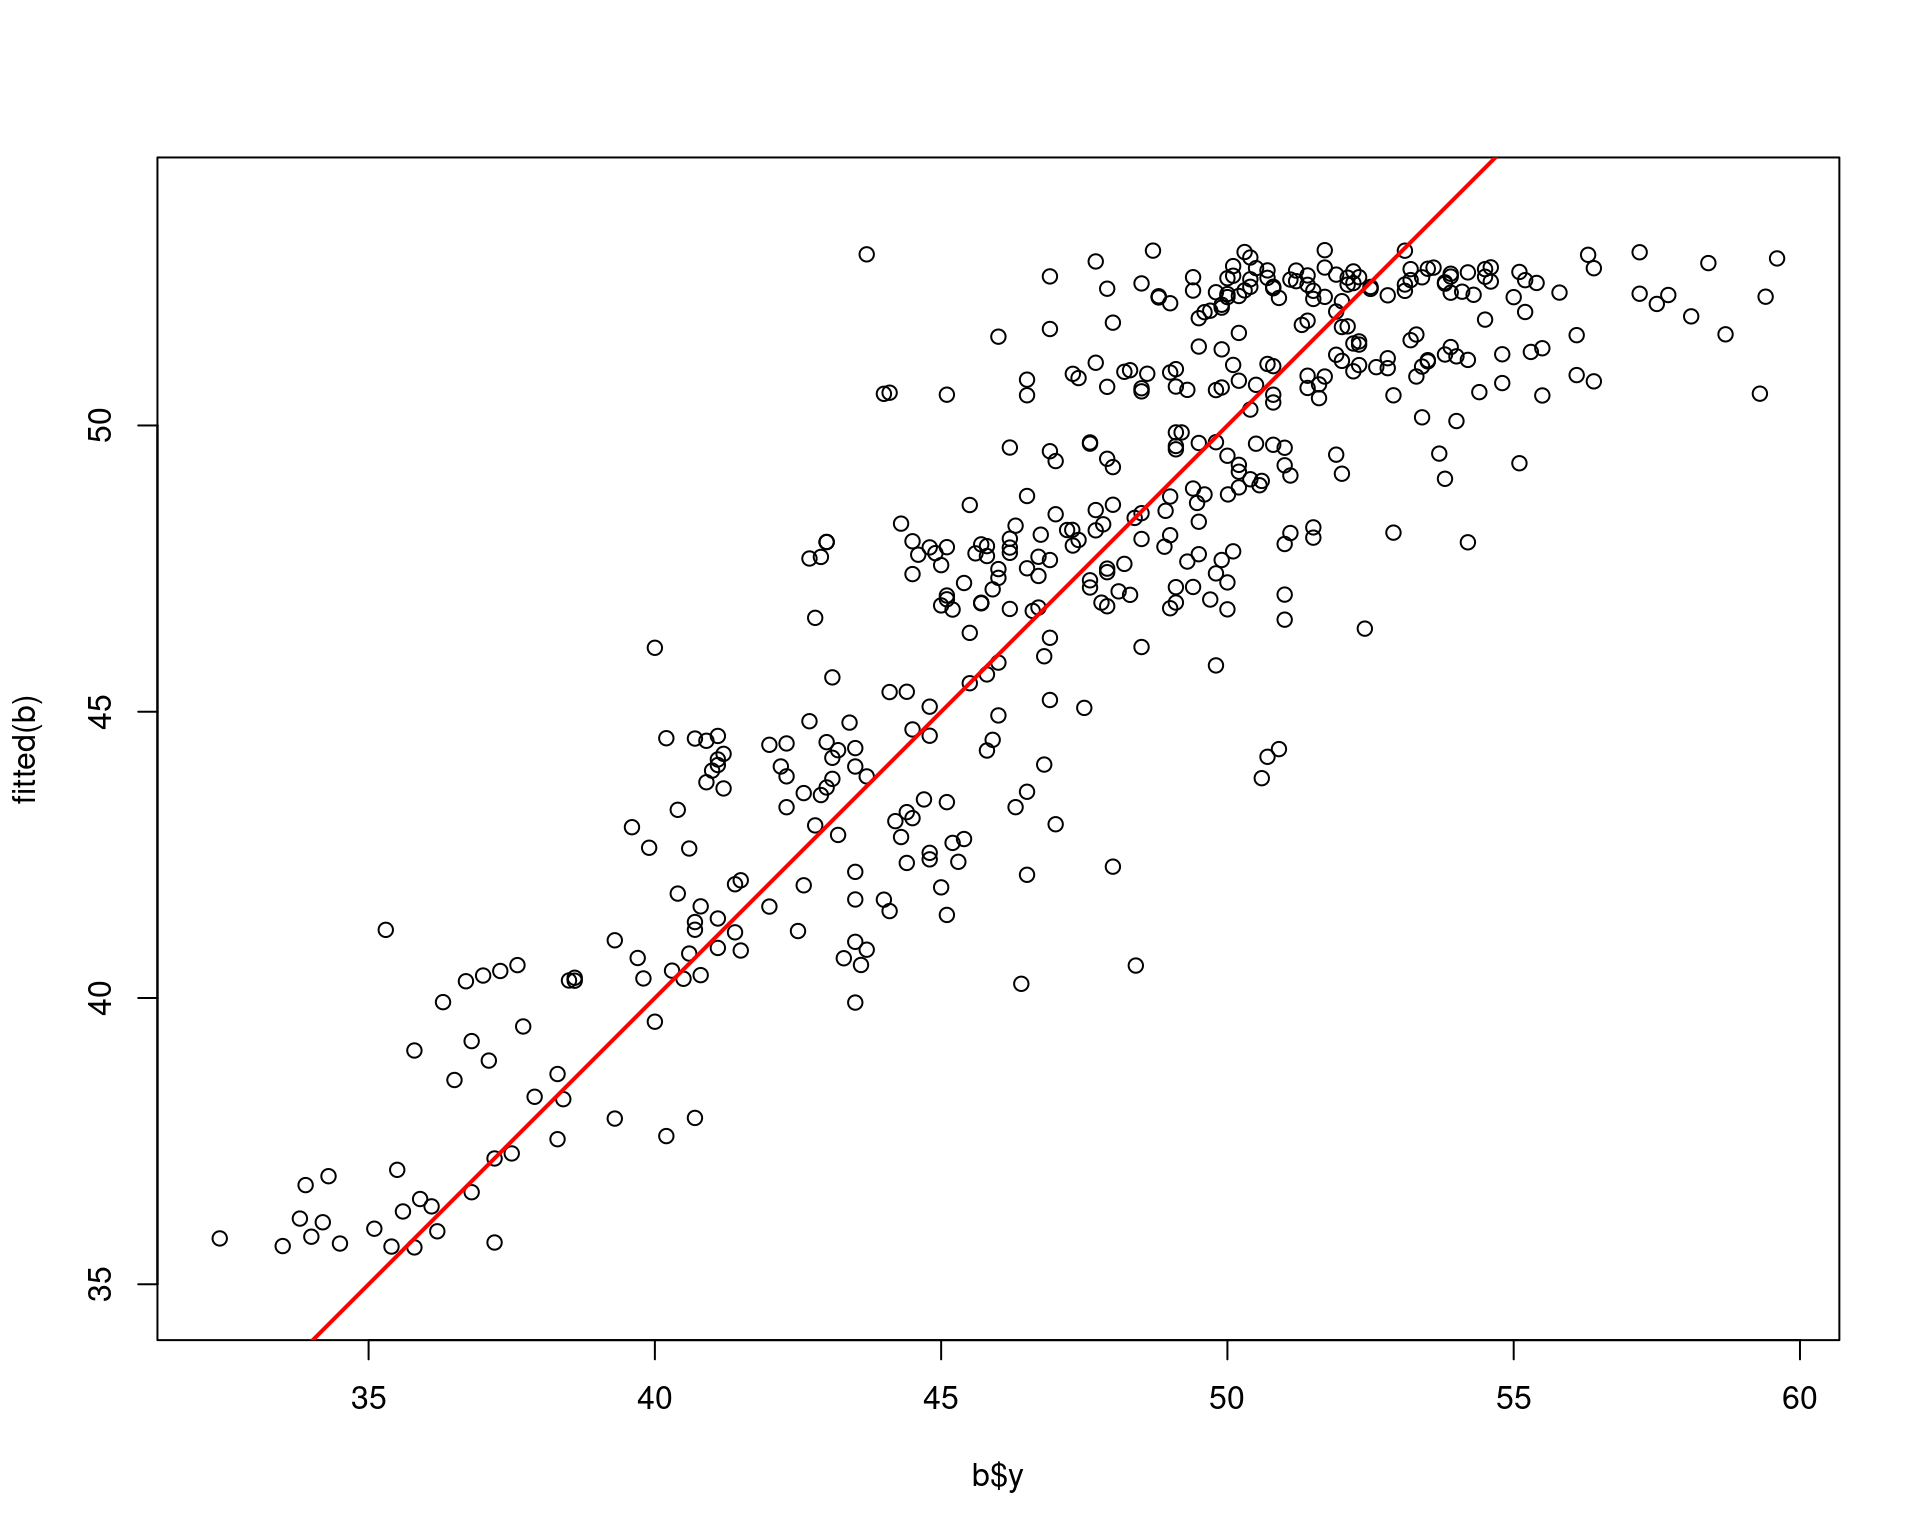
Can we just look at fitted vs. observed values?

This can be useful but there are lots of things to think about.

  • Fit
  • Out-of-sample performance
  • Distributional assumptions
  • … more!
plot(b$y, fitted(b), asp=1)
abline(a=0, b=1, lwd=2, col="red")
How good is the fit?

  • We have:
    • \(R^2\)
    • deviance explained
  • But they don’t tell us about out-of-sample performance
  • What to do?

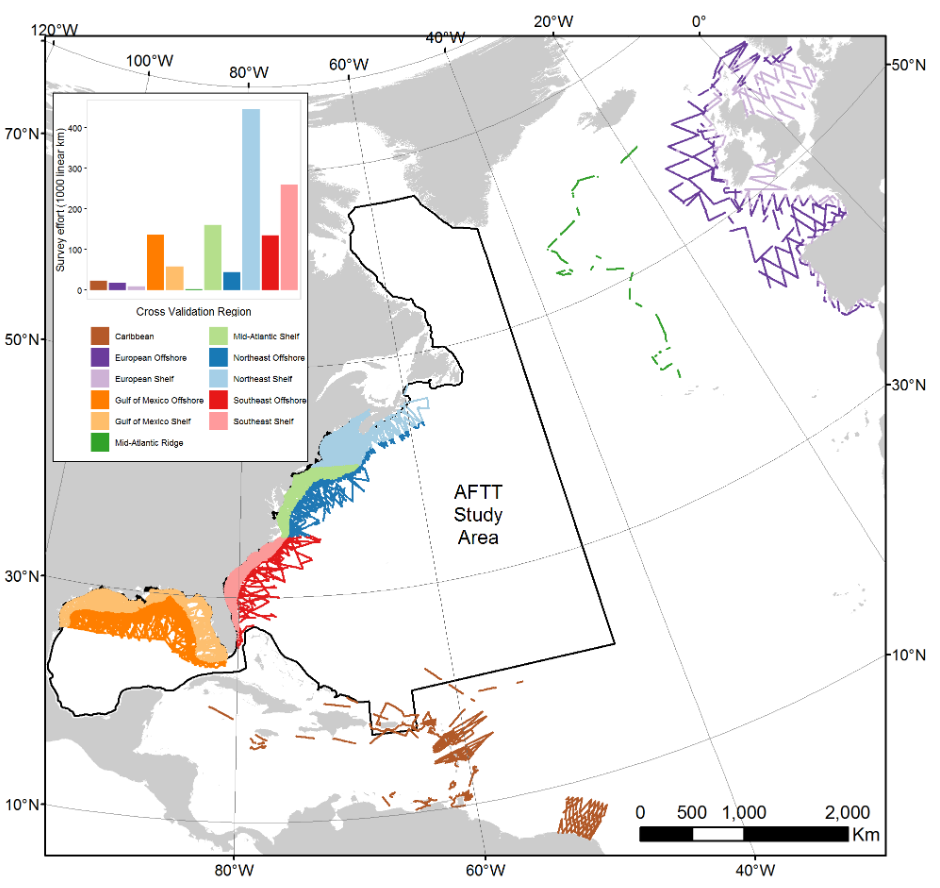
Cross-validation overview

  • Leave out some data when fitting
  • How good is the fit to the left-out data?

    Figure from Mannocci et al, (2017).

What about assessing model assumptions?

Residuals: what are they?

Residuals

  • Lots of definitions
  • “Raw” residuals: observed value - fitted value
  • Doesn’t work well with non-normal data

Deviance residuals

  • (Skipping Pearson residuals)
  • Deviance in a GLM \(\approx\) sum of squares in LM
  • \(\Rightarrow\) Scale by the deviance (roughly: difference from the “perfect” likelihood)
  • Definition:

\[ \epsilon_i^D = \text{sign}(y_i - \mu_i)\sqrt{d_i} \]

where \(y_i\) is data, \(\mu_i\) is prediction and \(d_i\) is the deviance for observation \(i\)
Deviance residuals (II)

  • We expect \(\epsilon_i^D \sim N(0, \phi)\)
    • where \(\phi\) is the scale parameter (\(\sigma\) for normal, 1 for Poisson etc)
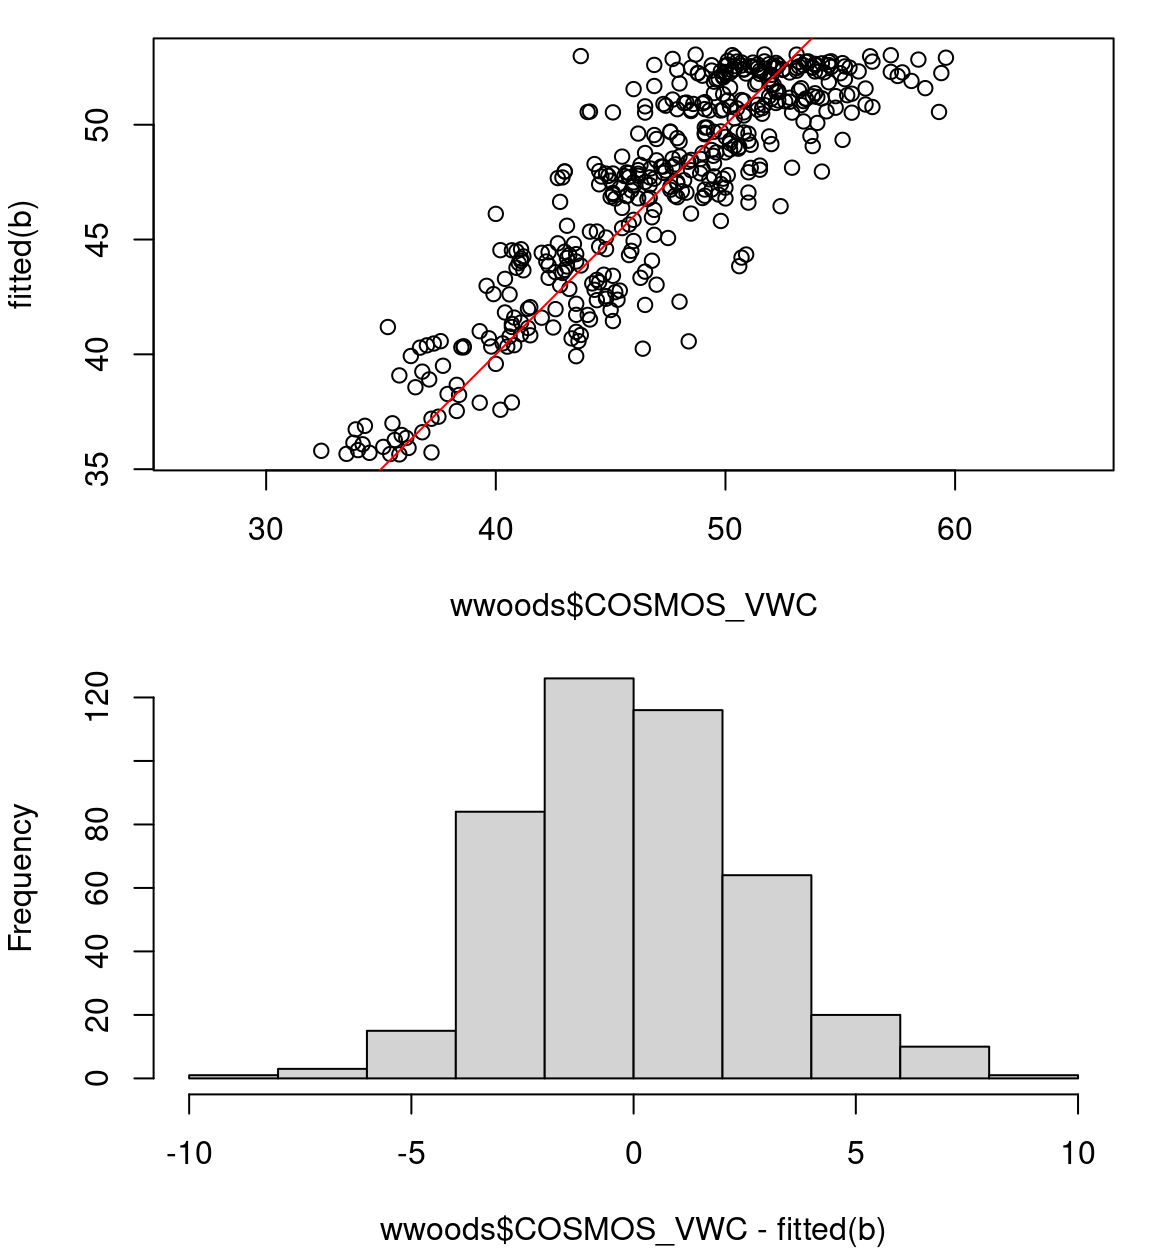
  • We can check distribution of \(\epsilon_i^D\) to see if it is normal

What does that tell us?

  • Want \(\epsilon_i^D \sim N(0, \phi)\), why?
  • Want: more small residuals, fewer larger ones
  • \(\Rightarrow\) better fit
  • We can dig into this more looking at a quantile-quantile plot

Quantile-quantile plot of residuals

  • Histogram can look okay, but still be problems
  • Q-Q plot tells us more
  • Close to line == good
  • Band tells us what are reasonable values for the model
qq.gam(b, asp=1, rep=200)

What about a \(t\) distribution?

  • Some tail action?
  • Would a scaled \(t\) distribution do a better job?
  • (No)
  • family=scat()
b_t <- gam(COSMOS_VWC ~ s(ndate),
           data=wwoods, method="REML",
           family=scat())
qq.gam(b_t, asp=1, rep=200)

What about other distributional assumptions?

Variance relationship

  • Plotting the residuals vs. predictions
    • (on link scale)
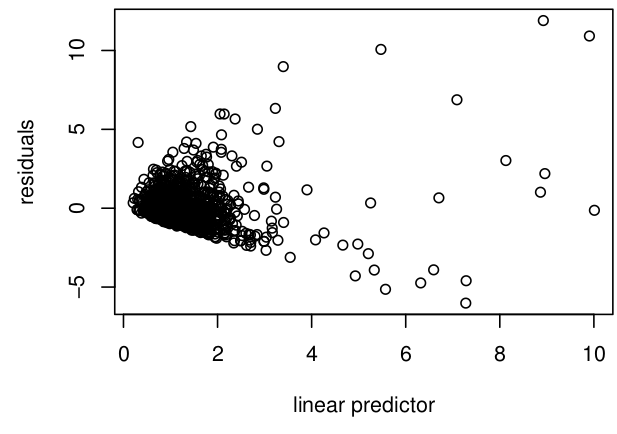
  • Expect a “blob”, no increase/decrease in spread
plot(fitted(b), residuals(b))

Bad variance relationship

  • Here variance increases with prediction
  • \(\Rightarrow\) incorrect mean-variance relationship

These are all useful plots, what if they were in the same place?

👌 gam.check() 👌

Selecting between/within models

Let’s add a term to our model

  • Let’s model all the sites in Scotland
  • Add a site-specific random effect
  • 2 models:
    • b0: COSMOS_VWC ~ s(ndate)
    • b1: COSMOS_VWC ~ s(ndate) + s(SITE_ID, bs="re")

Let’s add a term to our model

Comparing models by AIC

  • Akaike’s information criterion
  • Can just use AIC() in R:
         df      AIC
b0 10.68555 122738.4
b1 15.89472 109391.2
  • b1 is the better model!

AIC problems

  • Comparing between discrete models
  • Do we think this is a good idea?
  • What about “shrinking” to the right model?

Term selection during model fitting

Adding some more variables

b_all <- gam(COSMOS_VWC ~ s(ndate) +
                          s(SITE_ID, bs="re") +
                          s(ALTITUDE, k=5) +
                          SOIL_TYPE,
             data=scot_sites, method="REML")

What does that look like?

summary(b_all)

Family: gaussian 
Link function: identity 

Formula:
COSMOS_VWC ~ s(ndate) + s(SITE_ID, bs = "re") + s(ALTITUDE, k = 5) + 
    SOIL_TYPE

Parametric coefficients:
                      Estimate Std. Error t value Pr(>|t|)    
(Intercept)             40.991      4.860   8.435   <2e-16 ***
SOIL_TYPEOrganic soil    3.909     17.766   0.220    0.826    
---
Signif. codes:  0 '***' 0.001 '**' 0.01 '*' 0.05 '.' 0.1 ' ' 1

Approximate significance of smooth terms:
              edf Ref.df        F p-value    
s(ndate)    8.841  8.992  165.575  <2e-16 ***
s(SITE_ID)  2.999  3.000 4753.831  <2e-16 ***
s(ALTITUDE) 1.000  1.000    0.174   0.676    
---
Signif. codes:  0 '***' 0.001 '**' 0.01 '*' 0.05 '.' 0.1 ' ' 1

R-sq.(adj) =  0.579   Deviance explained = 57.9%
-REML =  54725  Scale est. = 49.913    n = 16208

What does that look like?

plot(b_all, pages=1)

Term selection

  • Looks like s(ALTITUDE) is not needed?
  • But still a slope? (EDF=1)
  • Can we remove? (Yes)
  • Can we remove during fitting? (Also yes)

Why is that slope still there?

  • Going back to penalties…

\[ \lambda \int_\mathbb{R} \left( \frac{\partial^2 s(x)}{\partial x^2}\right)^2 \text{d}x\\ \]
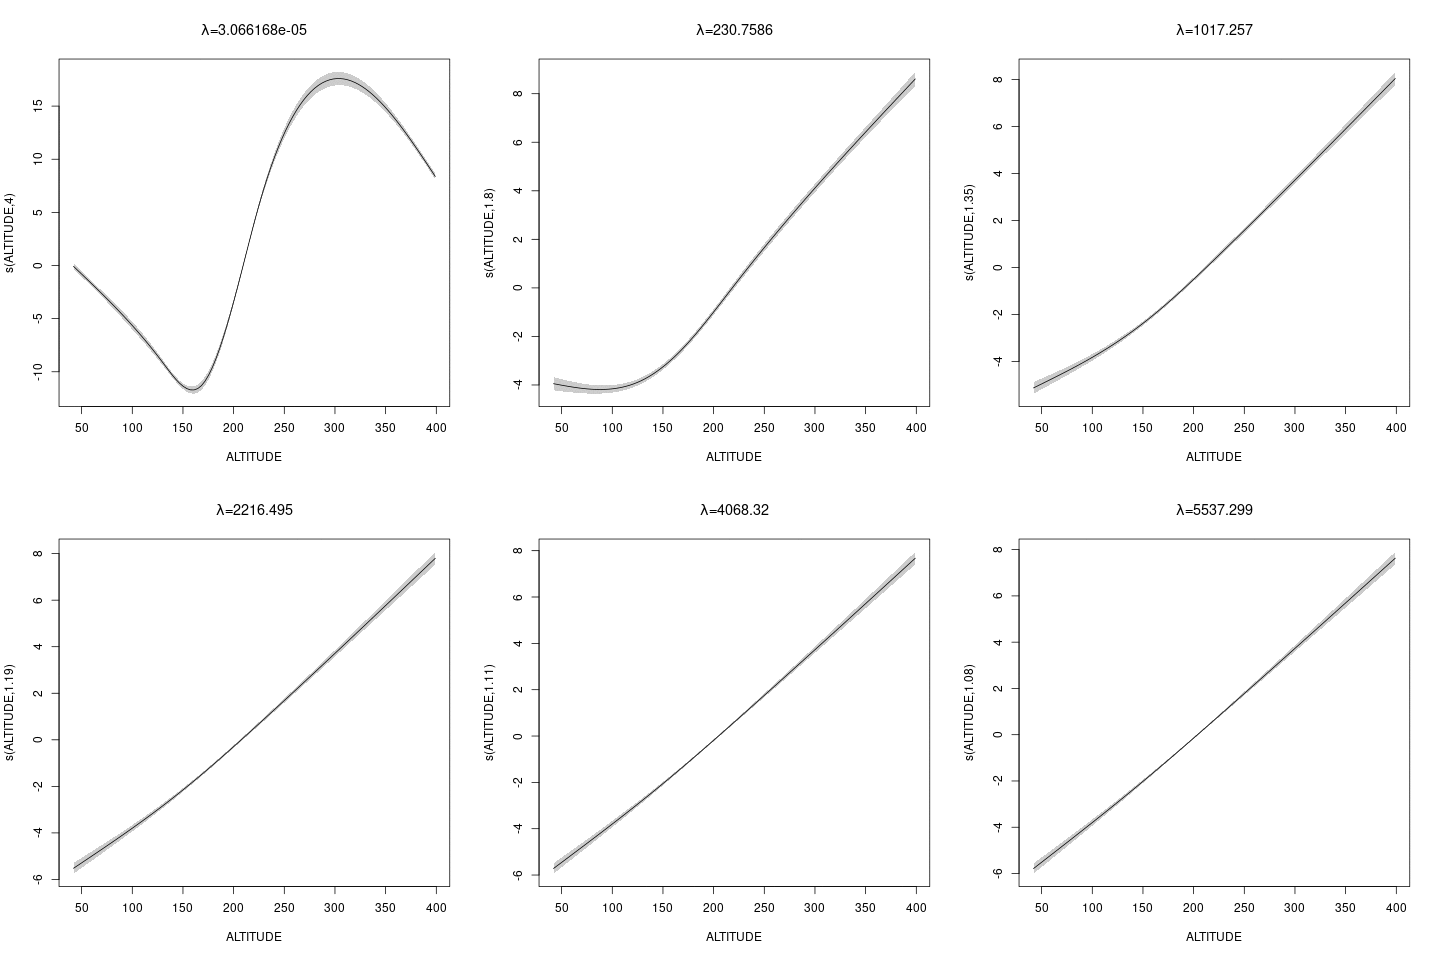
  • bits of \(s(x)\) without 2nd derivatives have no penalty

Term selection via shrinkage basis

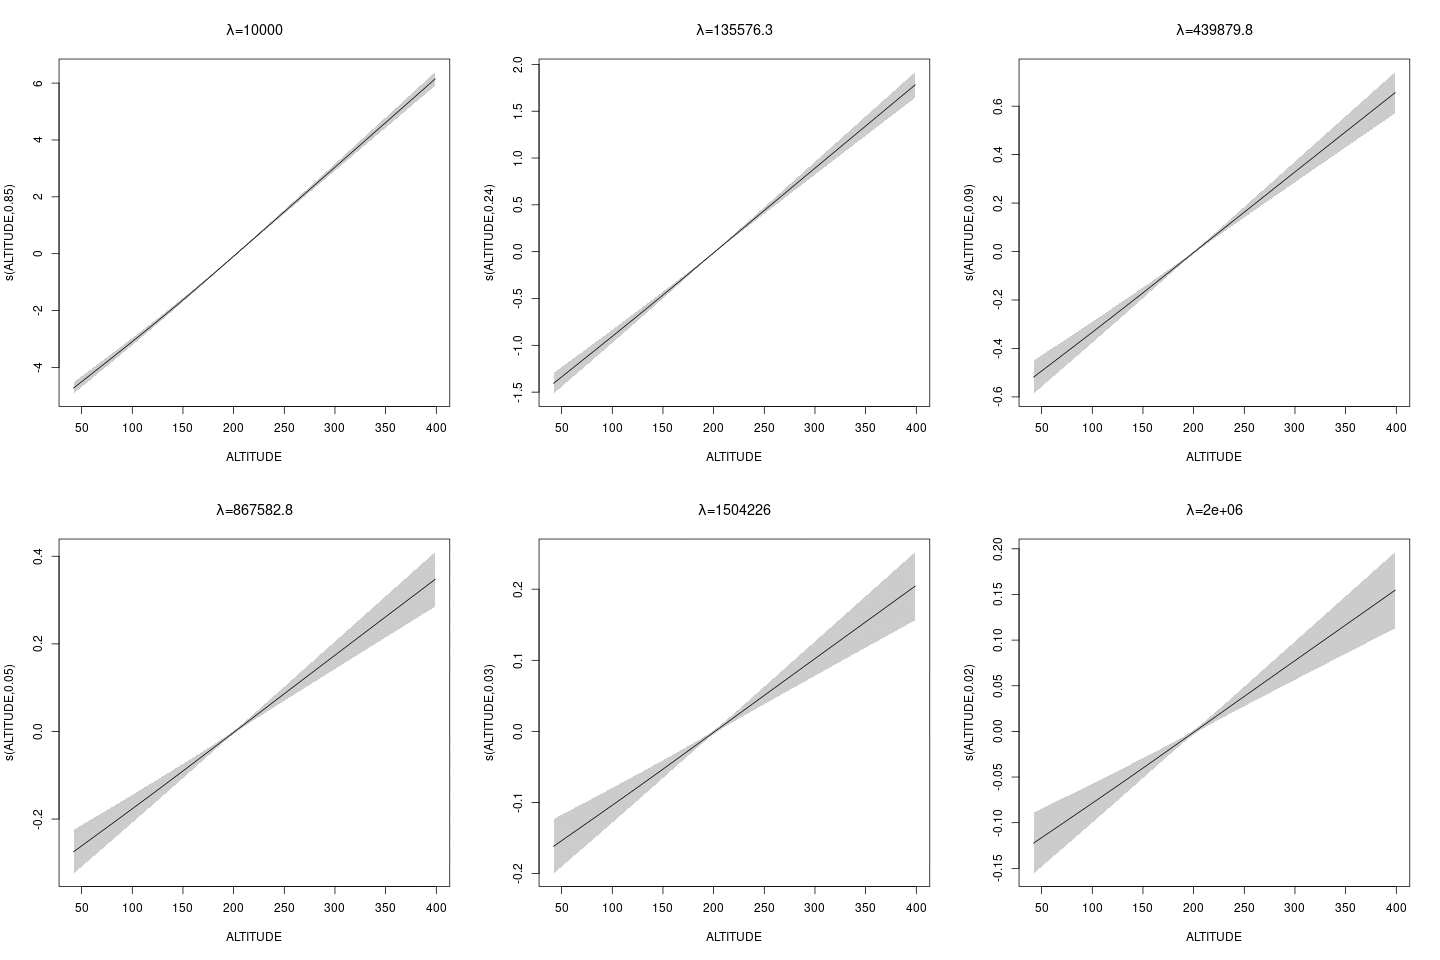
  • as we make \(\lambda\) bigger, the smooth gets flatter and flatter
  • EDF gets smaller
  • up to a point…

Term selection via shrinkage basis

  • bs="ts" as we make \(\lambda\) bigger, then penalty works for nullspace terms
Shrinkage basis

b_all_ts <- gam(COSMOS_VWC ~ s(ndate) +
                             s(SITE_ID, bs="re") +
                             s(ALTITUDE, k=5, bs="ts") +
                             SOIL_TYPE,
                data=scot_sites, method="REML")

What does that look like?

summary(b_all_ts)

Family: gaussian 
Link function: identity 

Formula:
COSMOS_VWC ~ s(ndate) + s(SITE_ID, bs = "re") + s(ALTITUDE, k = 5, 
    bs = "ts") + SOIL_TYPE

Parametric coefficients:
                      Estimate Std. Error t value Pr(>|t|)    
(Intercept)             39.821      3.550  11.216   <2e-16 ***
SOIL_TYPEOrganic soil   10.113      8.698   1.163    0.245    
---
Signif. codes:  0 '***' 0.001 '**' 0.01 '*' 0.05 '.' 0.1 ' ' 1

Approximate significance of smooth terms:
                  edf Ref.df        F p-value    
s(ndate)    8.8413793  8.992  165.574  <2e-16 ***
s(SITE_ID)  3.9983209  4.000 3777.345  <2e-16 ***
s(ALTITUDE) 0.0002275  4.000    0.008   0.637    
---
Signif. codes:  0 '***' 0.001 '**' 0.01 '*' 0.05 '.' 0.1 ' ' 1

R-sq.(adj) =  0.579   Deviance explained = 57.9%
-REML =  54728  Scale est. = 49.913    n = 16208

What does that look like?

plot(b_all_ts, pages=1)

Shrinkage recap

  • We don’t need s(ALTITUDE) anyway
    • s(SITE_ID, bs="re") handles all the variation
  • We can apply to all terms
    • Slightly slower fitting

Recap

  • \(R^2\)/deviance explained don’t tell you that much
  • Cross-validation is the gold standard
  • gam.check to see residual diagnostics
  • AIC() works like you expect
  • Can remove terms while fitting using bs="ts"